Hyperplotter
Hyperplotter Graphic Utility
Fabio Compagnone, I-CODE s.r.l.
Welcome to the Graphical tool for interactive on-line plot of curves and surfaces! This utility has been developed by the ICODE Staff.
HOW TO Plot a data file
To plot with Hyperplotter just click on the "file name" label in the directory windows and if, the file extension is associate with Hyperplotter (tipically a .dat file),a new pop-up window applet will open (in the follow example you can plot the dens_e.dat file).
In this window you will be able to display in a graphical form the content of the file generated in the simulation, to set up your plot, to print it and save it as a bitmap JPG picture.
|
At
the top you have menuto load new data file in the plotter.In the figure
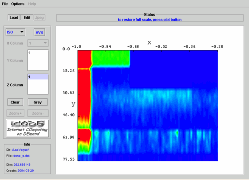
you can see the 2D contour map of the electron density in a HEMT device
obtained by the Monte Carlo simulation (from the file '' dens_e.dat
'').
Note that the x and y axis represent the grid points. |
|
Hyperplotter
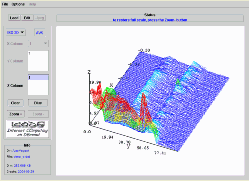
allows you to perform 2D and 3D plot. Moreover, 3D plot can appear as a
contour plot (as in the example before) or as a three dimensional plot
as in the following To switch between the two modalities use the
buttons Iso Plot and 3D plot.
With HyperPlot you can zoom (activate zoom+mouse action), rotate (mouse action), set the axis labels (set labels) and change the grid size, color scale and z scale (z scale compression). |
|
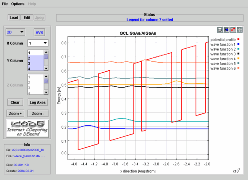
If you need to plot 2D curves you must select 2D instead of Iso/3D. In this case you can choose from a multicolumn formatted file, the column which represent the x axis, and the y1, y2, ... columns (one or more) to be plotted in the graphic. To plot more than one curve, simply press SHIFT or CTRL key when you select a new data column. In the right-up side of the plot area you have buttons allowing you to print the file on your local printer, to reset the axis to their original default, to set up your graphic format and finally to rescale the plot area to fit all the data values. In the Option menu section you can define the legend label associated to each curve in the plot. |


